Zabbix

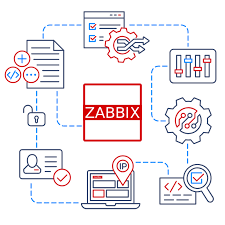
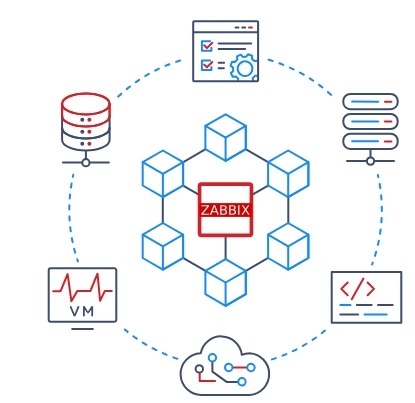
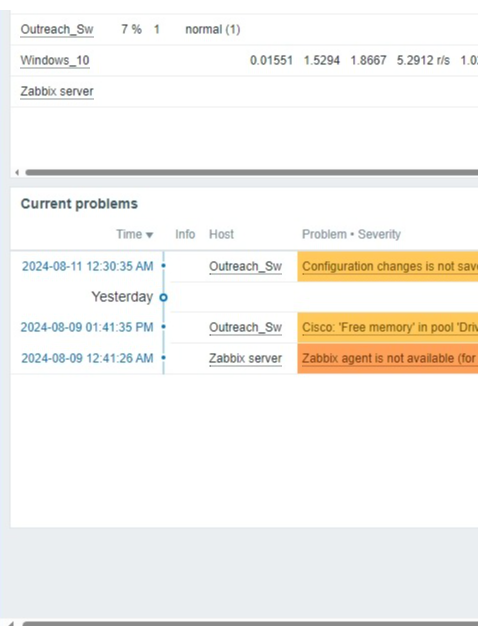
Zabbix is an open-source monitoring solution designed to track the performance and availability of IT infrastructure, including servers, networks, and applications.

Zabbix Overview

01.

Components

  • Server: Collects and processes data.
  • Database: Stores data and settings.
  • Agents: Installed on hosts to gather and send data.
  • Frontend: Web interface for configuration and viewing data.

02.

Data Collection

  • Active/Passive Checks: Agents send or respond to data requests.
  • SNMP/IPMI: Collects data from network devices or hardware.
  • 03.

    Configuration

  • Items: Data points to monitor (e.g., CPU usage).
  • Triggers: Define conditions that indicate issues.
  • Actions: Automated responses like alerts.
  • 04.

    Visualization

  • Dashboards: Customizable views of data.
  • Graphs/Reports: Visual and textual representations of data.
  • 05.

    Notifications

  • Alerts: Send messages through email, SMS, or other channels.
  • If you want to see the demo how Zabbix is working in your network, please clock below.

    Note: Demo user credentials are

    Username: demo

    Password: zabbix@123

    Click here